


Application performance issues show up as slow screens and instability at peak hours. The usual reaction is to optimize the code that looks guilty or to add servers. Without measurements, optimizing the suspect code and adding servers are guesses, and teams can spend weeks tuning a component that was never the bottleneck.
At QAlified we run performance tests for financial institutions and other organizations with critical systems. This guide follows the order we use with them: symptoms, telemetry, isolation, validation, and the point where outside help pays off.
Diagnose application performance issues by defining the problem first and then measuring. Compare response times, slow SQL statements, and server resource usage against a historical baseline, drill down the request path to find the layer that adds the delay, and confirm the cause with a repeatable load test before changing anything.
TL;DR
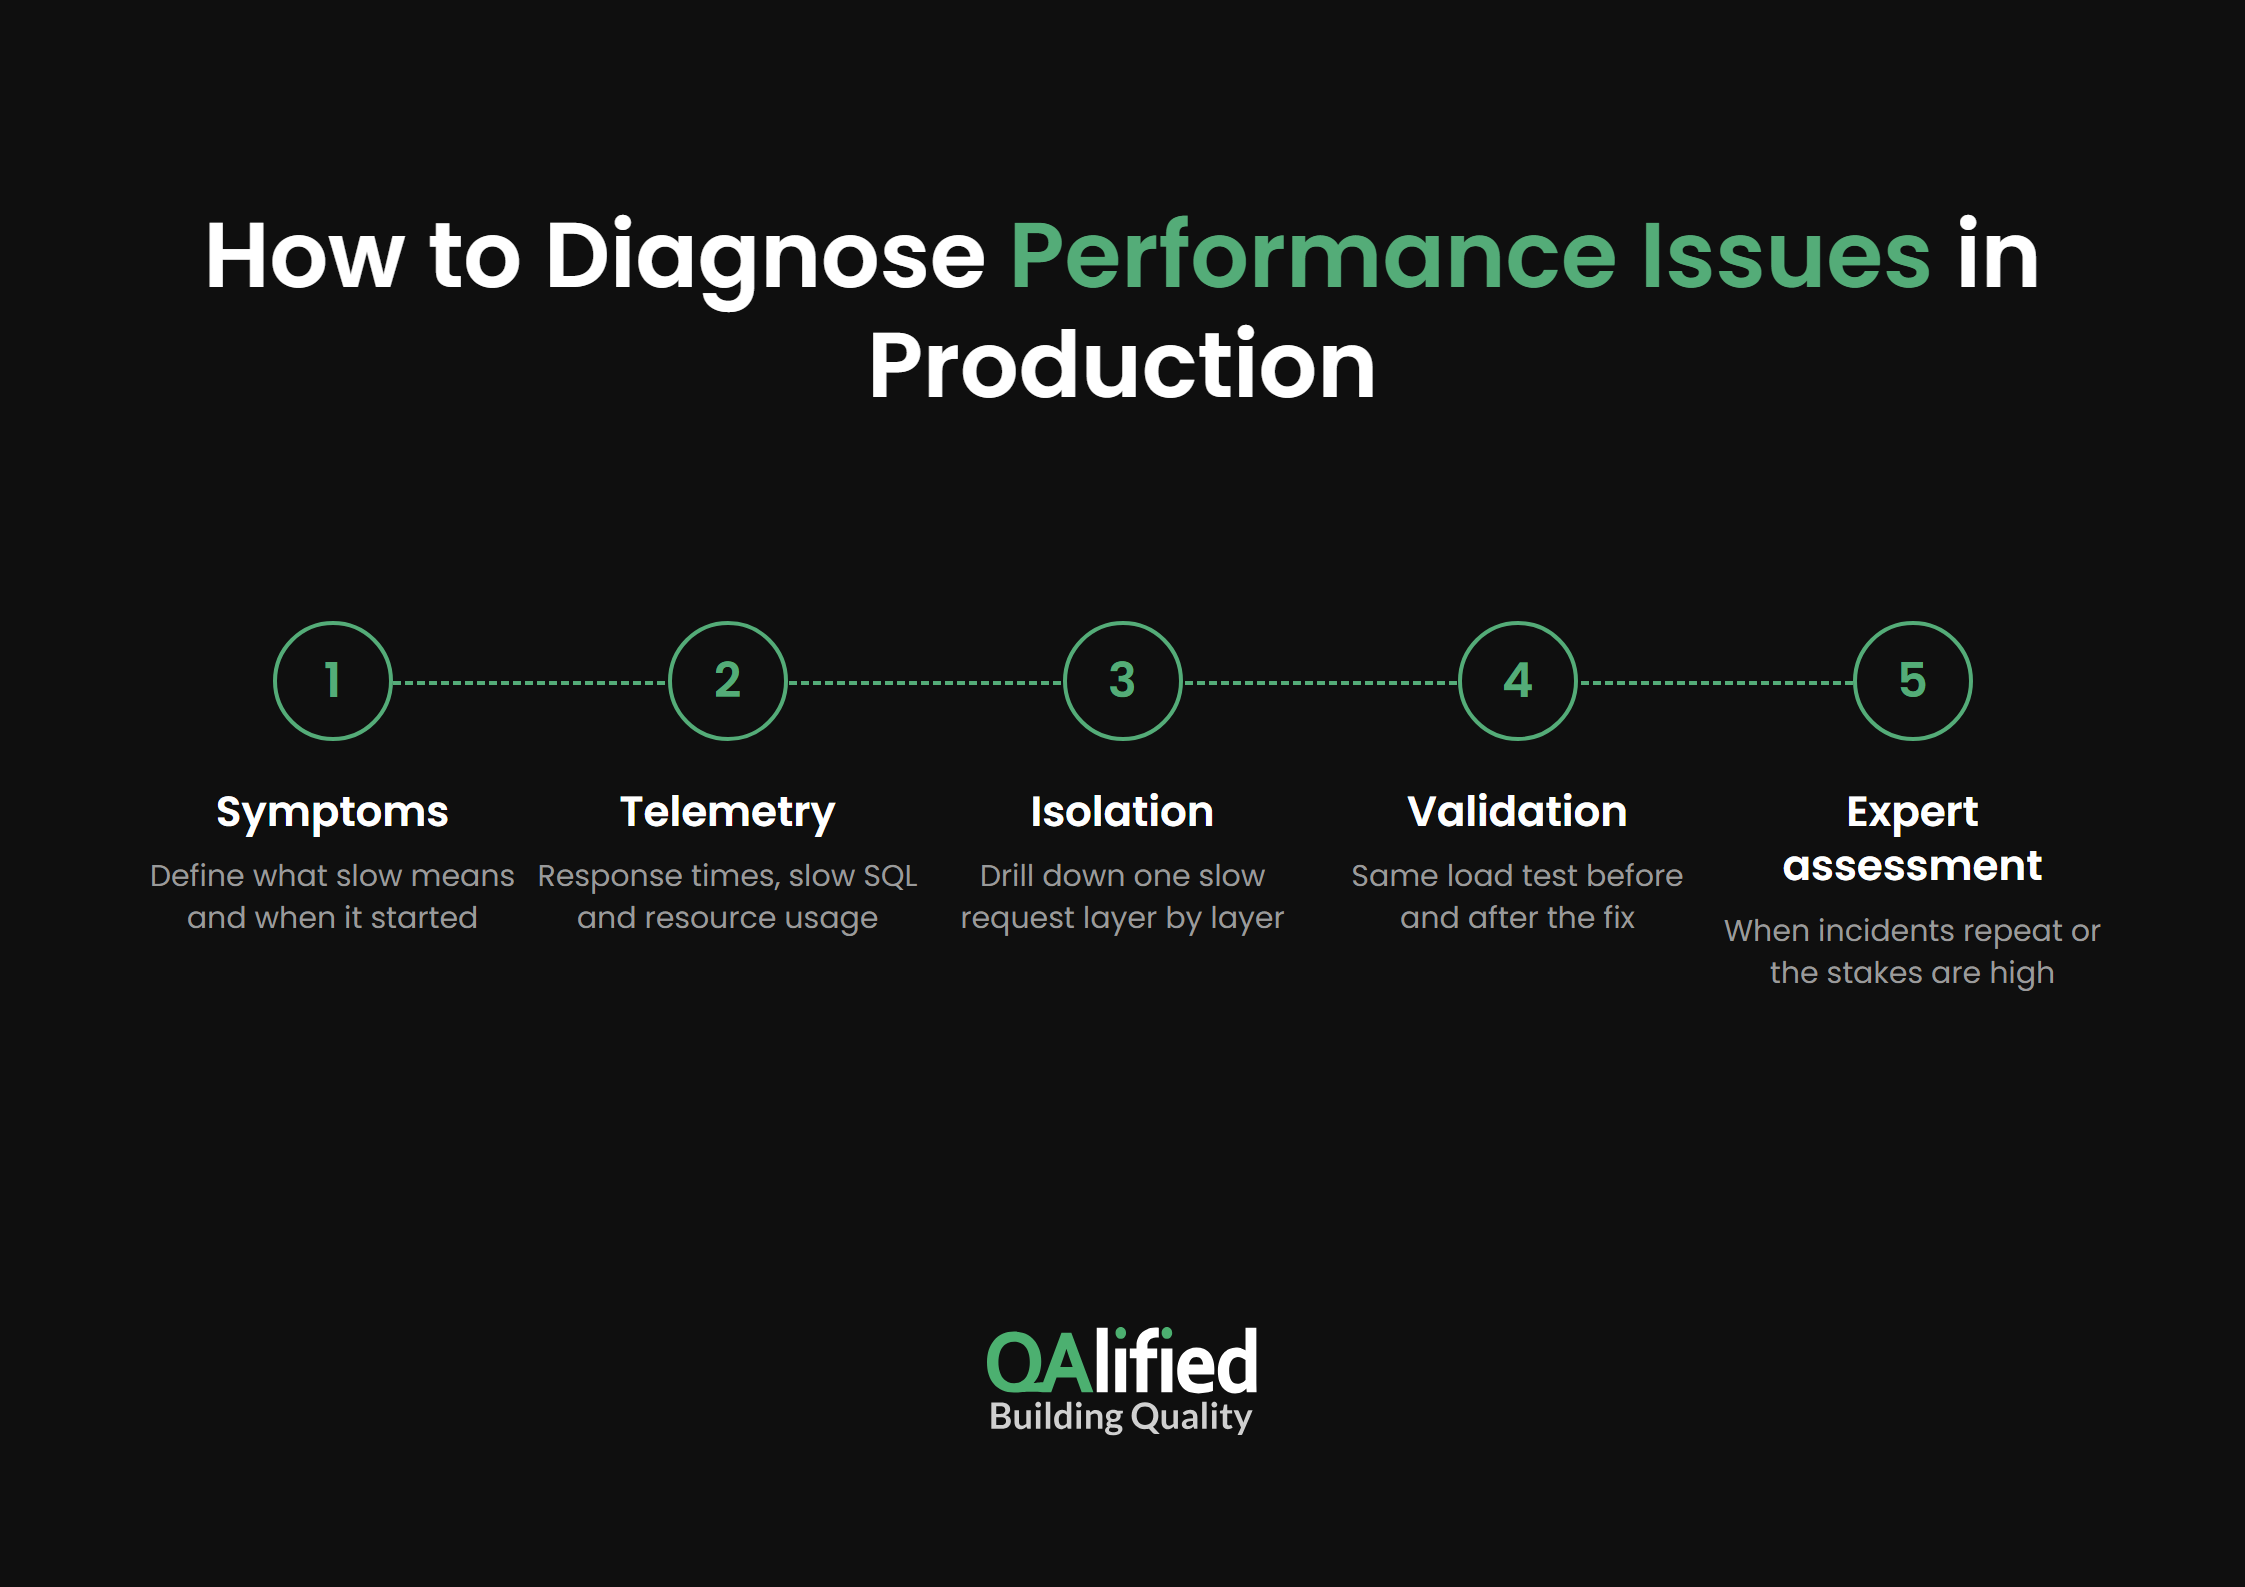
- Define what “slow” means, when it started, and when the problem counts as solved.
- Review total response time, the slowest SQL statements, and server resource usage, and read percentiles instead of averages.
- Follow one slow request through the frontend, APIs, database, infrastructure, and external services until the delay appears.
- Reproduce the real load with a representative test and run the same test before and after each fix.
- Request a professional assessment when incidents repeat, the cause stays unclear, or a high-load launch or critical migration is coming.
Which Symptoms Signal Application Performance Issues in Production?
The first symptom of a performance problem in production is general slowness and instability during peak hours. Users notice slow screens and a system that behaves differently depending on the time of day.
How Do You Tell Slowness from Functional Errors That Only Appear Under Concurrency?
A functional error that appears only under certain conditions, mainly concurrency, is a different problem from a performance issue and needs a different fix. Separating the two before any tuning starts keeps the team from working on the wrong cause.
What Should You Ask When Someone Reports Slowness?
A slowness report is only a starting point. Five questions turn a report into something that can be diagnosed:
- Does the slowness affect the whole system or only specific screens?
- Is it constant all day, or does it concentrate in certain time windows?
- What does “slow” mean, and were those response times measured?
- When did it start?
- Does the system show an error at any point, or is it only slow?
Which Transactions Do You Investigate First in a Performance Diagnosis?
Prioritize transactions by their criticality for the business and by the severity of the problems found. A slow payment confirmation that every customer uses outranks a slow report that two analysts open each month.
What Metrics, Logs, and Traces Should You Check First?
Start with total response time and the response time of the slowest SQL statements, backed by server resource usage analysis and access logs that match each slow request to what the infrastructure was doing at that moment.
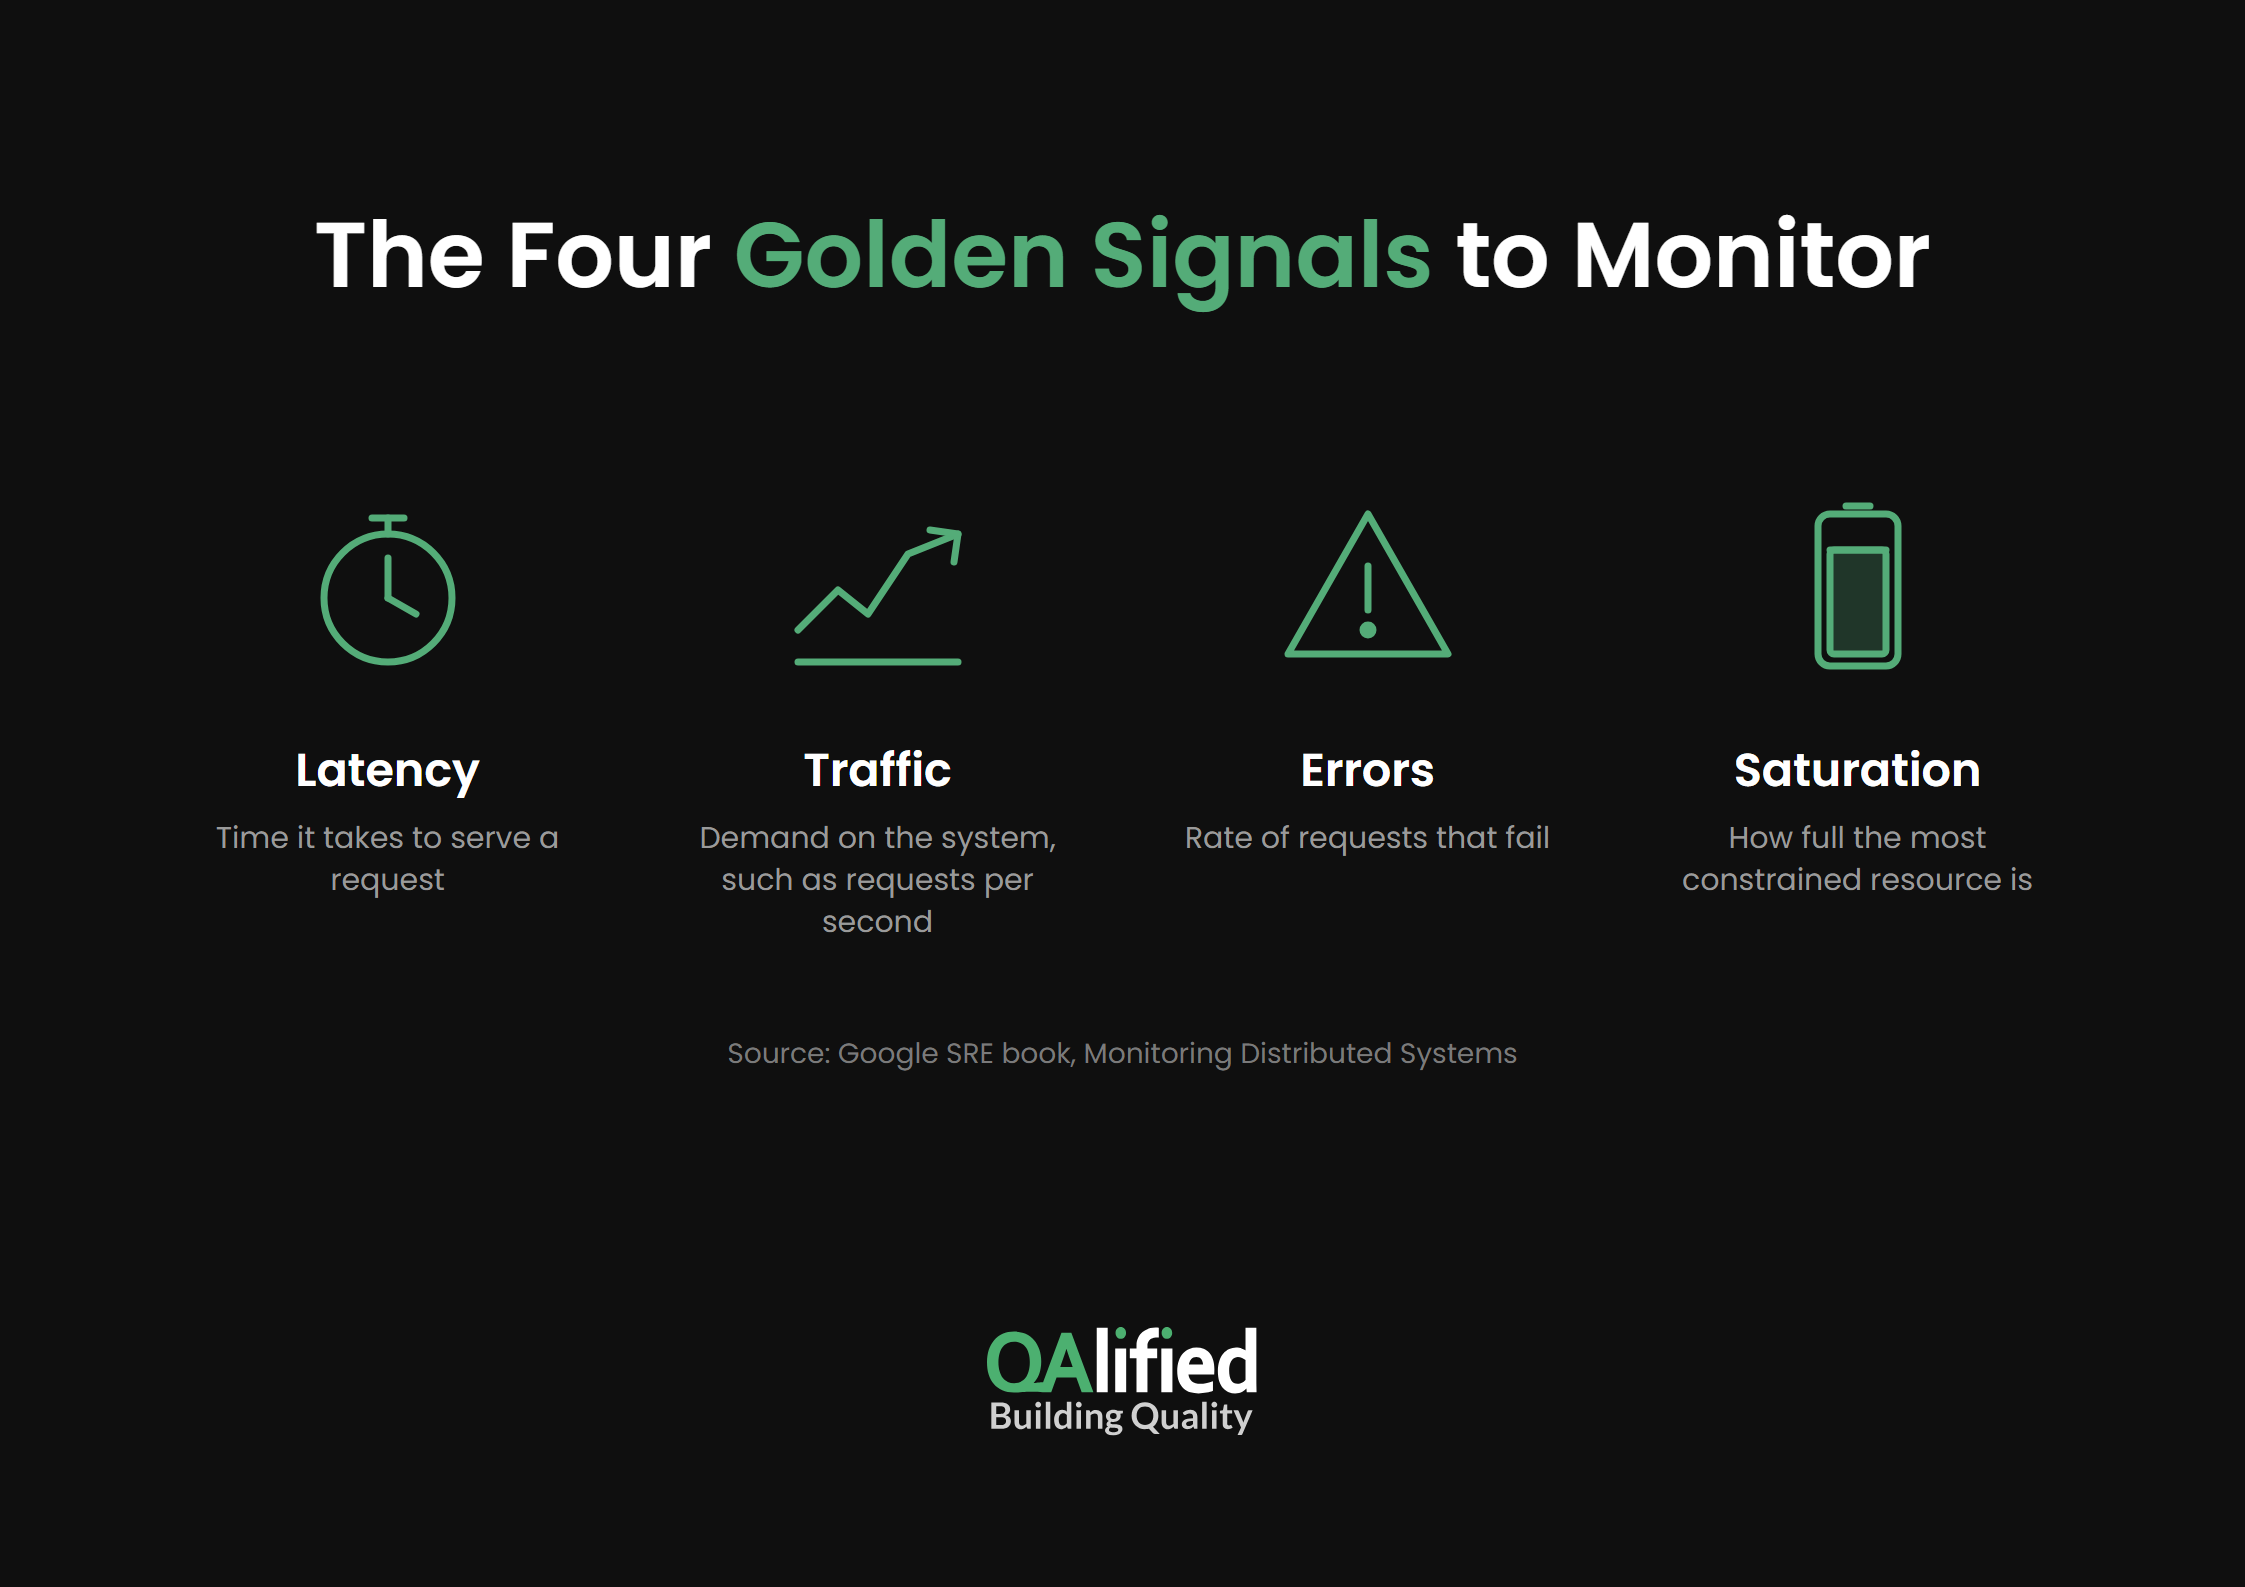
The Google SRE book names four signals to measure in any user-facing system:
- Latency: the time it takes to serve a request.
- Traffic: the demand placed on the system, such as requests per second.
- Errors: the rate of requests that fail.
- Saturation: how full the most constrained resource is.
Why Can Average Response Time Hide the Problem?
An average blends fast and slow requests into one number, so the extremes disappear: the very high times that hurt some users and the very low ones that pull the mean down.
The SRE book gives an example of a service with a 100 ms average latency where 1% of requests can still take 5 seconds. Track percentiles such as the 99th and the distribution of response times instead. A rising 99th percentile can also give an early signal of saturation.
How Do You Compare Current Behavior with the Usual Baseline?
Keep a historical record of response times and traffic. When no observability tools are installed, access logs provide the same statistics. Once you find the moment the degradation began, relate it to changes such as a code release, a configuration update, or higher traffic.
How Do You Isolate Performance Bottlenecks Across Application Layers?
A bottleneck can sit in the frontend, the APIs, the database, the infrastructure, or an external service. The table lists the signal that points to each layer and the check that confirms it.
| Layer | Signal | How to confirm |
|---|---|---|
| Frontend | The server answers fast, but the screen takes long to load for the end user | Compare server response time with the time the user waits for the loaded screen |
| APIs | A request spends most of its time inside one service call | Follow the request trace and measure the time of each call |
| Database | SQL statements take long to respond | Review the slowest SQL statements and look for locks such as deadlocks |
| Infrastructure | Server resources run saturated during the slow periods | Check server resource usage at the time of the slow requests |
| External service | The code makes synchronous, sequential calls to third parties that answer slowly | Time each third-party call separately from the rest of the request |
What Does a Drill-Down Look Like in Practice?
A drill-down follows the trace of one request with a high response time and measures how long each point of the infrastructure takes to answer.
If the server responds quickly but the screen takes long to appear for the end user, the problem is in the frontend. If the SQL queries take long to respond, the bottleneck is the database.
When Does Adding Resources Not Fix the Cause?
Teams often spend time optimizing a piece of code they believe is generating the slowness, without the measurements needed to confirm the theory.
Adding resources fails with database locks such as deadlocks, or with code that makes synchronous and sequential calls to slow third-party services. Against those causes, more CPU or more servers leave the waiting time untouched.
How Can Production Performance Testing and Load Testing Confirm Your Findings?
A load test turns the findings from production into a controlled experiment that confirms or rejects the suspected cause.
What Data Do You Need to Build a Representative Load Scenario?
Statistics from production define the scenario. A representative scenario needs, for example, the number of transactions per second, the transactions to include in the test, and the volume of data currently stored in the production database.
Should the Test Run in a Production-Like Environment or in Production?
Some architectures are too complex to replicate in pre-production because of their many interactions with other systems. In those cases, we recommend testing directly in production with these controls:
- Run the tests outside business hours, when the system has a defined usage schedule.
- Back up the database that the tests will impact.
- Notify users that the system will be under maintenance during the tests, when possible.
What Evidence Proves a Fix Worked?
The best evidence is a comparison of the results of the same test before and after the fix. If the fix solved the problem, response times, resource usage, or whichever metric exposed the problem should improve.
A before-and-after comparison works only when the team defined the problem and its solved state first, for example a target response time for a named transaction.
When Do You Need a Professional Performance Assessment?
A professional assessment makes sense when the stakes of a performance failure are high or when internal measurements cannot isolate the cause.
Which Signals Show That a Company Needs a Professional Performance Assessment?
Situations that call for a professional performance assessment include a new system about to go into production with a high expected load, the migration of a business-critical system, and poor performance that has started to cost the company clients.
What Should a Company Prepare and Receive in a Performance Assessment?
Before the engagement starts, the company needs a clear list of the problems it has today, or the ones it expects once the system opens to the general public.
At the end, it should receive the information needed to make decisions, such as test results, conclusions, and recommendations.
How Did a Bank Diagnose Slowness in Its Home Banking Platform?
The Bancop home banking project shows the sequence from symptom to intervention:
- Symptom: the bank reported slowness and instability in real-time operations such as movement queries, transfers, supplier payments, and salary payments.
- Suspected cause: a bottleneck in some component of the architecture, with no measurements to confirm it.
- Test: a representative load scenario built with Apache JMeter for web and mobile (Android and iOS), scaled up to 400 concurrent users on the highest-activity flows.
- Monitoring: infrastructure resources tracked together with the bank’s team during the test.
- Bottleneck found: the application server and the database.
- Intervention: adjustments on those components and recommendations for future scalability.
- Result: the bank evaluated its most critical operations under load, applied the adjustments, and received a knowledge transfer on the tool and the scripts to evolve the tests on its own.
Frequently Asked Questions
1. How Do You Define When a Performance Problem Is Solved?
A problem counts as solved when an agreed metric reaches its target under the same conditions that exposed it. Write the problem statement first: which transaction, under which load, and which response time or resource usage is acceptable. Then run the same test before and after the fix and compare the results.
2. Why Does the Volume of Data in the Production Database Matter for a Load Test?
A representative load scenario needs the volume of data that the production database holds today. Query times depend on how much data the tables contain, so a test against a small database can look fast and hide the slow SQL statements that production users hit.
How Can We Help You Diagnose and Address Application Performance Issues?
A diagnosis starts by defining the problem exactly and the point at which it counts as solved. Next comes the analysis that locates the main bottleneck, with a measurement at every step. Measuring before optimizing keeps the work pointed at the layer that holds the delay.
Our team designs load scenarios and validates fixes with repeatable tests through our Performance Testing as a Service. If your application slows down at peak hours or the same incidents keep coming back, tell us what you are seeing and we will help you plan the diagnosis.
SHARE:
