


Performance testing requires the use of specialized tools in order to tackle them in a professional manner and obtain the best results.
It is therefore important to understand at which point in the process a tool can be valuable. For this purpose, the diagram below presents the different types of tools involved in the different stages of the process.
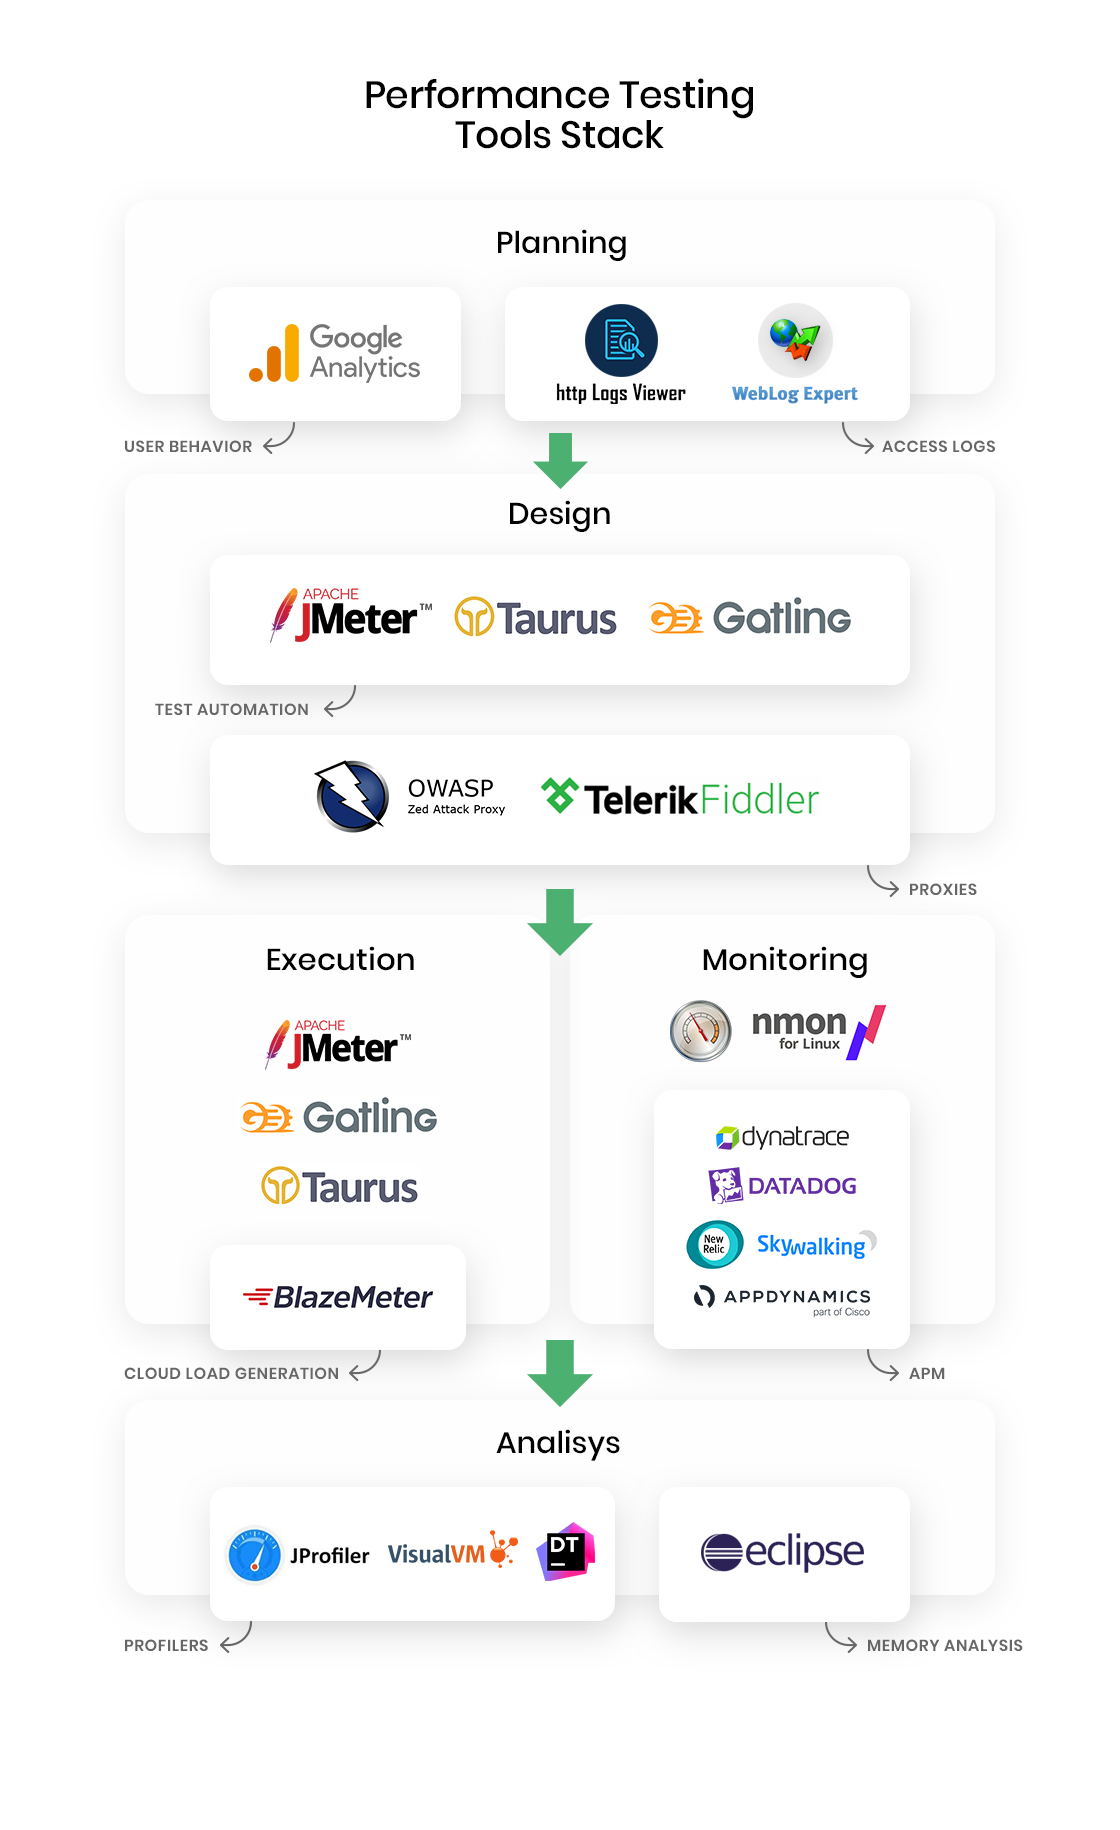
Test Planning
During test planning, it is important to determine the application’s critical flows, the types of users who interact with the app, and the load that will be simulated. In order to achieve this, it is necessary to interact with project managers and any other actors involved. However, and in order to complement this, most organizations already have applications in use which offer valuable information to scale load scenarios.
This information can be obtained from some kind of data log, whether it is at an application log level or with services collecting usage information regarding the application.
There are two ways to access this information that stand out: the first one is through services such as Google Analytics, and the second one through the analysis of HTTP access logs for Web applications.
Google Analytics
Is a service which captures traffic information regarding a website and its user activity, including the duration of the sessions, the most visited sites, and the most frequent actions. This service must already be implemented in the application in order to access the data. With this information as a starting point, more specific and representative tests can be created regarding the application’s actual demand and user activity.
Http Logs Viewer
Makes it possible to easily filter and analyze log files for Apache, IIS and Nginx servers. The tool offers statistics with information regarding the most executed queries, among others.
WebLog Expert
Makes it possible to access log files and statistics regarding user activity for an application, such as the files and screens they accessed, the routes they followed and the browser they used, among other data that will be represented graphically in the generated report.
To use these tools, it is necessary to request the administrator for access to application log files and to know the time period they corresponded to. Is it important to understand that the available information can vary and will depend on each server’s configuration.
Test Design and Automation
Performance tests are usually created by simulating different load scenarios for the application. This can be accomplished by generating HTTP traffic through scripts that execute the flows automatically, simulating the application usage for a predetermined volume of users.
There are many tools which make it easier to automate performance tests; the most popular open-source tools are Apache JMeter, Gatling and Taurus.
JMeter
Is probably the most widely used tool in the world for performance tests. It is developed in Java and is open-source. Among other features is the script recording functionality, which is how you can start coding quickly.
JMeter tests are defined in a visual tree element structure, which makes it easier to understand the flow of a test.
Gatling
Is a tool based on Scala, Akka and Netty. It is different from other tools because of its approach of coding tests with a domain-specific language (DSL). As with JMeter, Gatling has a script recording function to start automating tests.
Taurus
Is an automation framework with the peculiarity that tests are defined through YAML, which makes it easier to automate tests and obtain easy-to-read scripts as a result. This tool can be integrated with continuous development processes and offers the possibility of being integrated with other tools.
Many times, the test design and automation process requires supporting tools to understand the traffic between the application server and the browser. These types of proxy tools make it possible to visualize the aforementioned traffic and also help with the process of correlation in test scripts.
OWASP Zap
Is a free and open-source proxy which makes it possible to intercept HTTP traffic from within a browser. This way, different test flow records can be recorded, and the test flow can be used to support the correlation activities.
Fiddler
Is another proxy option which makes it possible to capture requests and responses.
Test Execution
The execution of performance tests consists of running the previously automated scripts indicating the load of users to be simulated, among other configurations.
In addition to their test design and automation functionalities, JMeter, Gatling and Taurus have features to execute these tests.
There are also other tools which make test executions easier by providing load generation machines in order to scale tests better when simulating heavy user volumes. The service offered by Blazemter is especially commendable.
Blazemeter
Offers a very complete load testing and reporting service. It makes it possible to carry out executions with heavy virtual user volumes using cloud load generation machines. This is a very good alternative when there is a requirement to simulate a heavy volume of simultaneous users and the resources for your load generation machines fall short.
Monitoring
While executing performance tests, it is important to carry out real-time monitoring of the different resources involved in the application.
In addition to the application’s response times, data which can be obtained using the same execution tools, it is necessary to measure the consumption of resources for each of the different components; mainly application servers, databases and links. Most commonly, the monitored resources are server memory, CPU usage, network data input/output and disk read/write activities.
This is not a simple task, so it is recommended to request the support of each platform specialist. However, it is still important to have access to some of the tools in case you are the ones who will be performing these monitoring tasks.
There are tools which deal with monitoring specifically and work at an operating system level such as Perform for Windows and Nmon for Linux.
Perfmon (Performance Monitor)
Is a native Windows tool. It has a graphic interface which displays the real-time behavior of each selected indicator. It offers the possibility of configuring the collection of different indicators for a specific time periods for further analysis
Nmon
Is a similar Linux-based tool. Using the command line, users can see real-time indicator graphs displayed in the console.
In addition to the interactive mode, it also allows users to record the monitoring information into a file for further analysis.
Other APM tools are also useful for this purpose and are focused on integral application control, controlling the different architecture components. Additionally, these tools are also ideal to continuously monitor the application when it is operating
There are many APM tools, some of them licensed and some free. The most popular ones are listed below:
- Dynatrace
- New Relic
- Datadog
- AppDynamics
- Apache SkyWalking
Results Analysis
After the test execution has been completed, there will be a considerable amount of information to analyze in order to understand the results. This information comes from different tools which have different levels of detail.
The most commonly obtained information coming from test execution tools is related to response times and the generated actual concurrency. They also make it possible to generate reports in a centralized manner and, in some cases, through graphic reports, in order to better interpret the obtained results.
Valuable information is also obtained by monitoring resources and, generally, there is a considerable amount to process. Tools such as Perform for Windows have the capacity to report the collected data. In contrast, Nmon has a plugin called Nmon Analyzer to obtain a summary and graphs in Excel.
In addition, when there are performance issues or there is a high consumption of the involved resources, a deeper analysis must be carried out.
There are techniques and tools specific for this type of analysis for each platform; among them are “Profilers”. These types of tools make it possible to look at the chain of requests for an application, and the memory and CPU usage for each of the components in the chain, with the aim of detecting which of the chain’s links is generating the problem.
There are different profiler tools, such as JProfiler, Java VisualVM and dotTrace, among others.
Occasionally, there is a need to incorporate an additional tool into the process; for example, to analyze an application’s memory usage when memory leaks are suspected. These types of tools require what is known as memory “dumps”; that is, information downloads for a given time. These “dumps” are analyzed automatically by tools which provide a low-level report of what was detected. For memory issues in Java applications, the Eclipse Memory Analyzer tool is recommended.
Summary
In summary, performance tests require the use of a considerable tools stack in order to plan and design tests and automate scripts, to execute test scenarios, monitor application resources and analyze the obtained results.
There is a very large number of tools with different features and licensing models. Therefore, it is important to understand the main objective of the performance tests and the desired results in order to identify the tools that will actually add value to the process.
SHARE:

